# load in packages
library(tidyverse)
library(readr)
library(dplyr)
library(knitr)
library(openintro)
library(mosaicData)Research Question
Although the sex ratio for newborn babies seems as though it should be a random phenomenon, an article by UTSouthwestern Medical Center explains that there may actually be a genetic explanation based on the biological father. If the assumption that sex was up to chance were true, then all men who have reproduced would always have had an equal amount of X chromosomes and Y chromosomes in their sperm; however, there may be an imbalance towards Y chromosomes for biological fathers, as there is a greater likelihood for women to have baby boys instead of girls. The null hypothesis assumes that there is no inherent relationship for the likelihood of the sex of a baby; thus, if the null hypothesis can be rejected then the alternative hypothesis - that sex is not equally probable - can further be explored scientifically.
For my analysis, I will be using the “Births” dataset from the MosaicData package in R Studio. I plan on finding the proportions of both female and male babies, to first reveal if there is in fact an inclination towards the male sex for newborns. Afterwards, I plan on creating a function to simulate the random categorization of babies based on sex, and further using this function to find the p value and ultimately determine if the null hypothesis can successfully be rejected.
Function and P-Value
# set seed for reproducability
set.seed(47)
# import data set
baby_data <- births
# find proportion of female babies born
female_prop <- baby_data |>
  summarize(proportion = mean(sex_baby == "female")) |>
  pull()
female_prop
[1] 0.4533333# find proportion of male babies born
male_prop <- baby_data |>
summarize(proportion = mean(sex_baby == "male")) |>
pull()
male_prop[1] 0.5466667# create a function
total_babies <- nrow(baby_data)
random_sex <- function(rep, total_babies) {
result = sample(c("female", "male"), size = total_babies,
replace = TRUE, prob = c(0.5, 0.5))
return(mean(result == "male"))
}
# find p value
num_rep <- 10000
random_map <- map_dbl(1:num_rep, random_sex, total_babies)
p_val <- sum(random_map >= male_prop) / num_rep
print(p_val)[1] 0.1407Sex-Ratio Bar Plot
# create a bar plot showing the difference in sex ratio
ggplot(data.frame(baby_data), aes(x = sex_baby)) +
  geom_bar(color = "black", fill = "lightpink") +
  labs(
    title = "Biological Sex Ratio for Newborn Babies",
    x = "Sex",
    y = "Count"
  )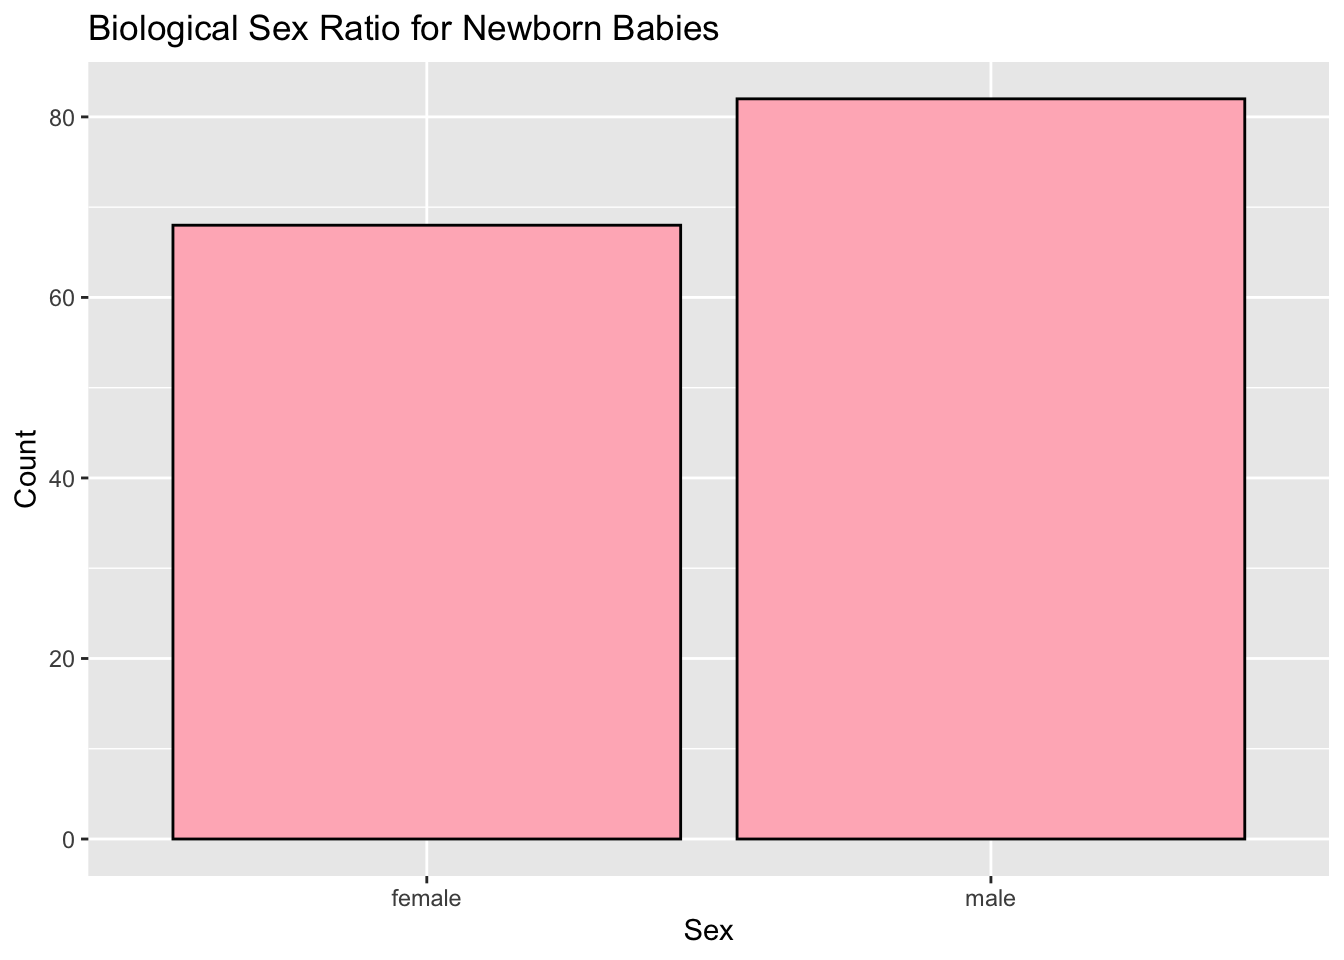
About The Bar Plot
This is a graph depicting the natural imbalance in the biological sex ratio for newborns. There is approximately a 10% difference between females and males, for this data set alone.
Permutation Test Histogram
# create a new data frame for graphing
sim_data <- data.frame(simulated_male_prop = random_map)
# create a histogram depicting the proportion of male births and the p-value
ggplot(sim_data, aes(x = simulated_male_prop)) +
  geom_histogram(binwidth = 0.01, color = "black", fill = "lightblue") +
  geom_vline(xintercept = male_prop, color = "hotpink", linetype = "dashed", size = 1) +
  labs(title = "Distribution of Simulated Male Proportions",
       x = "Simulated Male Proportion",
       y = "Frequency")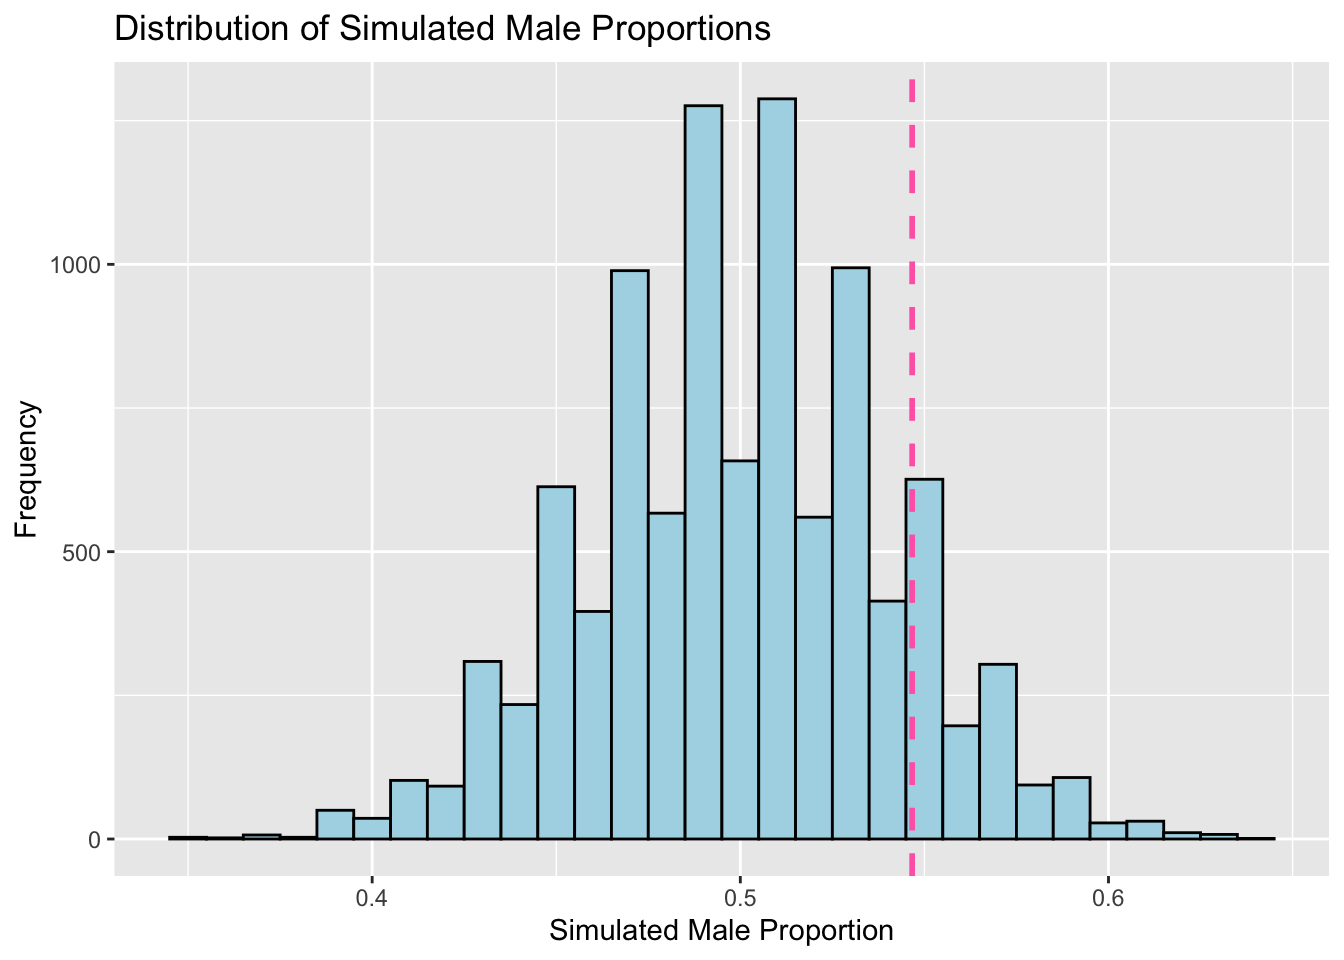
About The Histogram
This is a graph showing the tendency for male proportions, when simulated many times, to arrive at the center (or around 0.5 out of the birthing population). The pink v-line, or the x-intercept, depicts the actual male proportion in birthing rates (0.5466667); however, although this line is slightly skewed to the right, the difference is not significant.
Conclusion
Ultimately, although my code did prove that there is a slight inclination for the probability that women will birth male babies instead of females, with the P-Value being 0.1407, the null hypothesis that this is due to complete randomness, cannot confidently be rejected. There is not strong enough evidence against the null hypothesis; however, if I were to repeat this analysis, I would do another permutation test using variables for both the baby’s sex and the father’s X/Y ratio, for there may be a stronger relationship there. Currently, there is not much research on this correlation, so I’d most likely need to conduct my own research or wait until somebody believes that this imbalance in the probability of sexes is significant enough to explore, despite the P-Value.
Citation
I retrieved the original data from the MosaicData package within R. The data for this ‘Births’ package, however, originated from the National Vital Statistics System and exported to csv by Robert Kern.