# load in packages
library(tidyverse)
library(readr)
library(dplyr)
library(knitr)
# import data set
office_lines <- read.csv("the-office_lines.csv")
# filter out Jim's lines when he says "Pam" in every season
Jim_lines <- office_lines |>
  filter(Character == "Jim") |>
  filter(str_detect(Line, "\\bPam[a-z]*\\b")) |>
  group_by(Season, Episode_Number) |>
summarize(n = n(), .groups = "drop") Code To Count ‘Pam’
Bar Plot of ‘Pam’ References
# plot of Jim's frequency of the word "Pam"
ggplot(Jim_lines, aes(x = Episode_Number, y = n, fill = Season)) +
geom_col() +
labs(
x = "Episode Number",
y = "# of 'Pam' Occurrences",
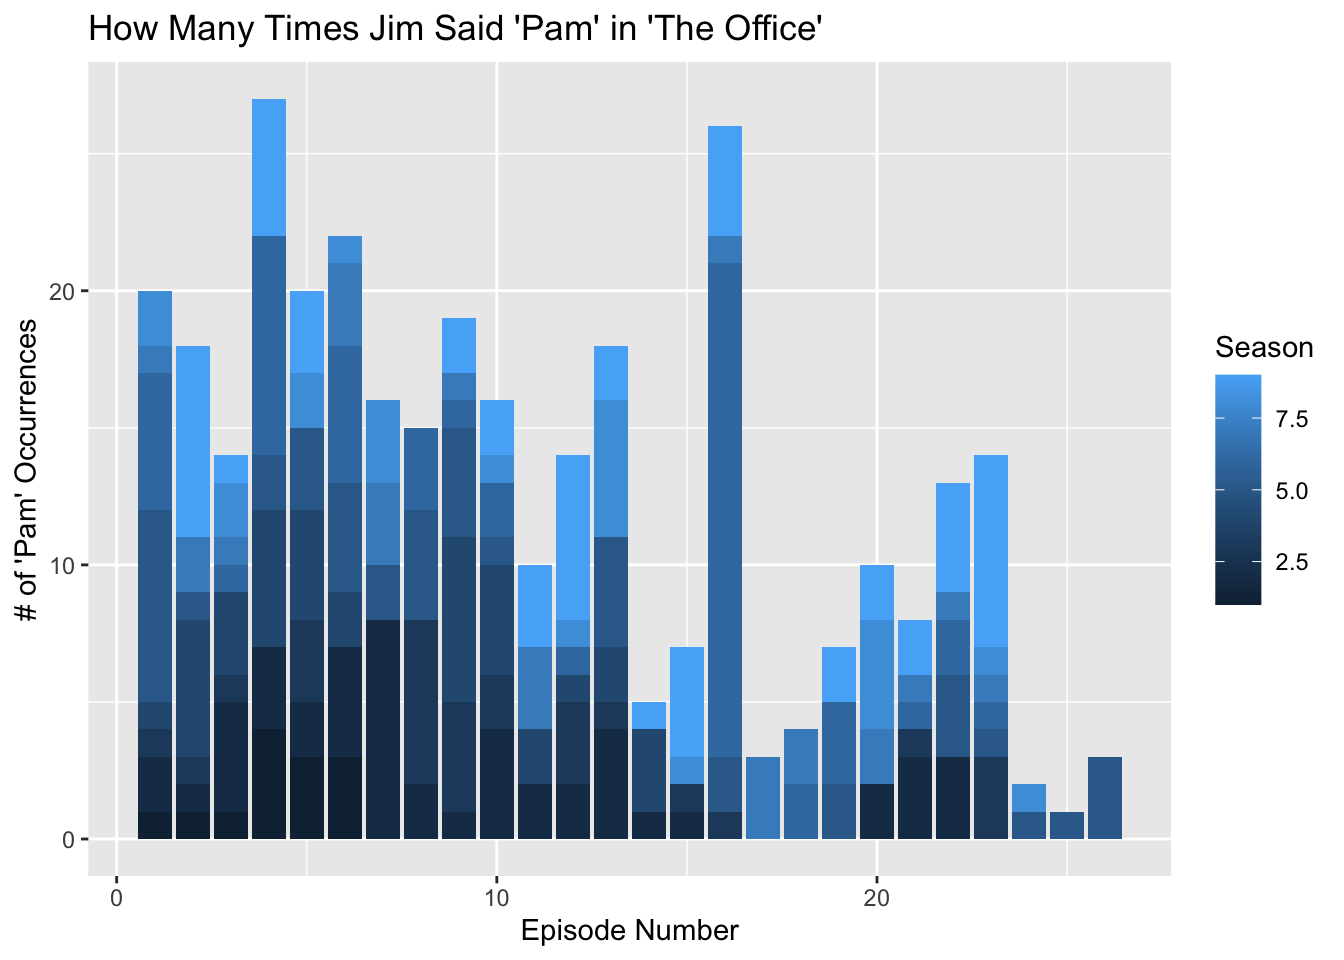
title = "How Many Times Jim Said 'Pam' in 'The Office'"
)
Analysis of ‘Pam’ Counting
“The Office,” although heavily referred to as a “comedy,” has one of the most popular romantic couples in television sitcom history: Jim and Pam. In this analysis, I counted how many times Jim said the name “Pam” / “Pamela” per episode in every season. The graph is also color-coded by season: getting a lighter shade of blue as the seasons progress. Based on the data, Jim said the name “Pam” the most on episode 4 collectively throughout every season, and this trend would decrease the longer a season went on. Ultimately, Jim referenced “Pam” in 123 episodes throughout the course of the TV show.
Code For Laugh Count
# detect whenever somebody laughs
laugh_counts <- office_lines |>
  filter(str_detect
         (str_to_lower
           (str_trim(Line)), "\\[laughing\\]|\\[laughs\\]")) |>
  group_by(Episode_Number, Season) |>
  summarize(n = n()) |>
  arrange(desc(n)) |>
  head(n = 10)
# create a table indicating laugh counts
kable(laugh_counts, caption = "Top 10 Laugh Counts by Season and Episode")| Episode_Number | Season | n |
|---|---|---|
| 10 | 8 | 13 |
| 18 | 9 | 13 |
| 6 | 1 | 11 |
| 23 | 3 | 11 |
| 23 | 9 | 11 |
| 5 | 9 | 8 |
| 13 | 7 | 8 |
| 1 | 1 | 7 |
| 4 | 1 | 7 |
| 16 | 9 | 7 |
Analysis of Top 10 Laugh Counts
“The Office” is well known for their improvisations and breaking of character, leading to genuine laughter adding on to the already scripted occurrences. The above table shows a list of the Top 10 episodes in which characters laughed during their lines. This displays how Season 8, Episode 10 and Season 9, Episode 18 have the most laughter within the episode, at a total of 13 laughs. Surprisingly, these episodes actually do not parallel with what fans think are the “funniest episodes.” Both ScreenRant and Collider ranked Season 2, Episode 12 as the funniest episode.
Citation
I retrieved the original data from a Kaggle dataset. This data was webscraped from OfficeQuotes.net and includes every line in ‘The Office’ from every season that aired on television.