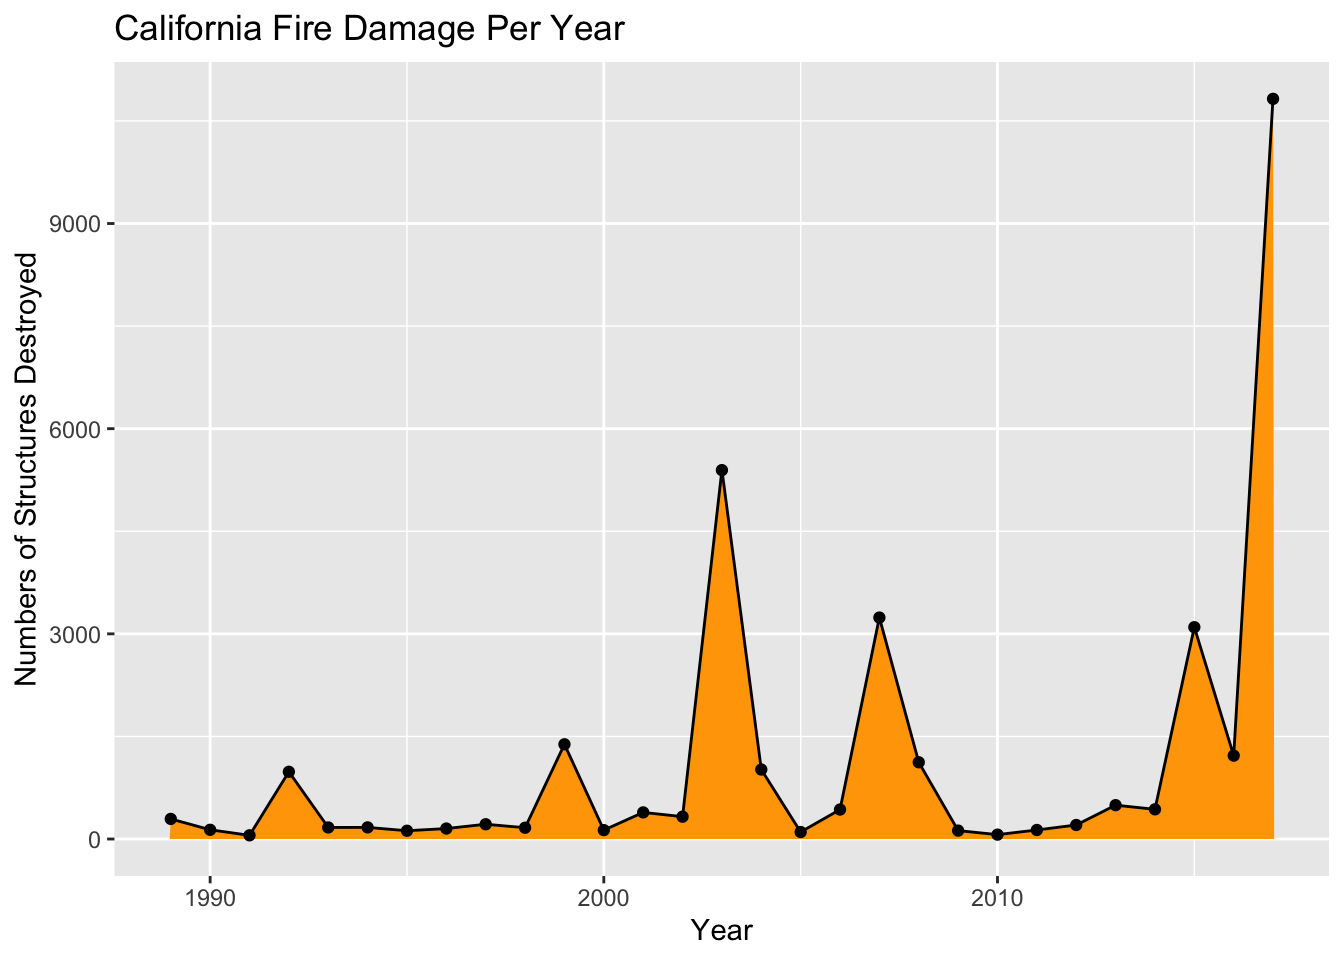
This is an analysis of the ‘California Fire Damage’ data set from TidyTuesday. In this project, I depict the relationship of the quantity of buildings destroyed in a California wildfire over a span of about 2-3 decades.
# load in packageslibrary(tidyverse)library(readr)# read in csv filecalfire_damage <-read.csv("calfire_damage.csv")# graph the relationship between structures burnt and year ggplot(calfire_damage, aes(x = year, y = structures)) +geom_area(fill ="orange") +geom_line() +geom_point() +labs(x ="Year",y ="Numbers of Structures Destroyed",title ="California Fire Damage Per Year", )
Analysis
According to the data and the graph above, the number of structures burned down in California peaked in 2017 with 10,823 buildings destroyed. According to Cal Fire (https://www.fire.ca.gov/incidents/2017), a total of 1,599,640 acres burned through the span of 9,270 wildfires. This year, however, may have suffered more than the graph depicts as this source also has reported 10,868 structures destroyed, instead of 10,823. This insinuates that the data may not be entirely accurate or fully collected at the time of this report.
Citation
I retrieved the original csv file from a Tidy Tuesday data set. This data originates from a Buzzfeed News article on wildfires in California by Peter Aldhous.